


Tableau vs Power BI vs Looker: Which Data Visualization Tool Is Best?
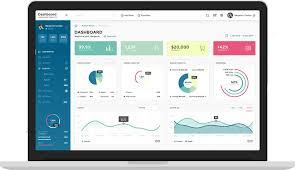
Data is everywhere today. Businesses collect information from sales, marketing, customers, and operations. But raw data is hard to understand. That is why companies use tools that turn data into charts, graphs, and dashboards.
This is where tools like Tableau, Power BI, and Looker come in. Many companies work with a power bi dashboard development company or choose custom data visualization solutions to make better use of their data. Businesses across industries also rely on data visualization services usa and expert data visualisation consulting services to build smart dashboards.
But the big question is simple. Which tool is the best? Let us understand each tool in a simple way and compare them.
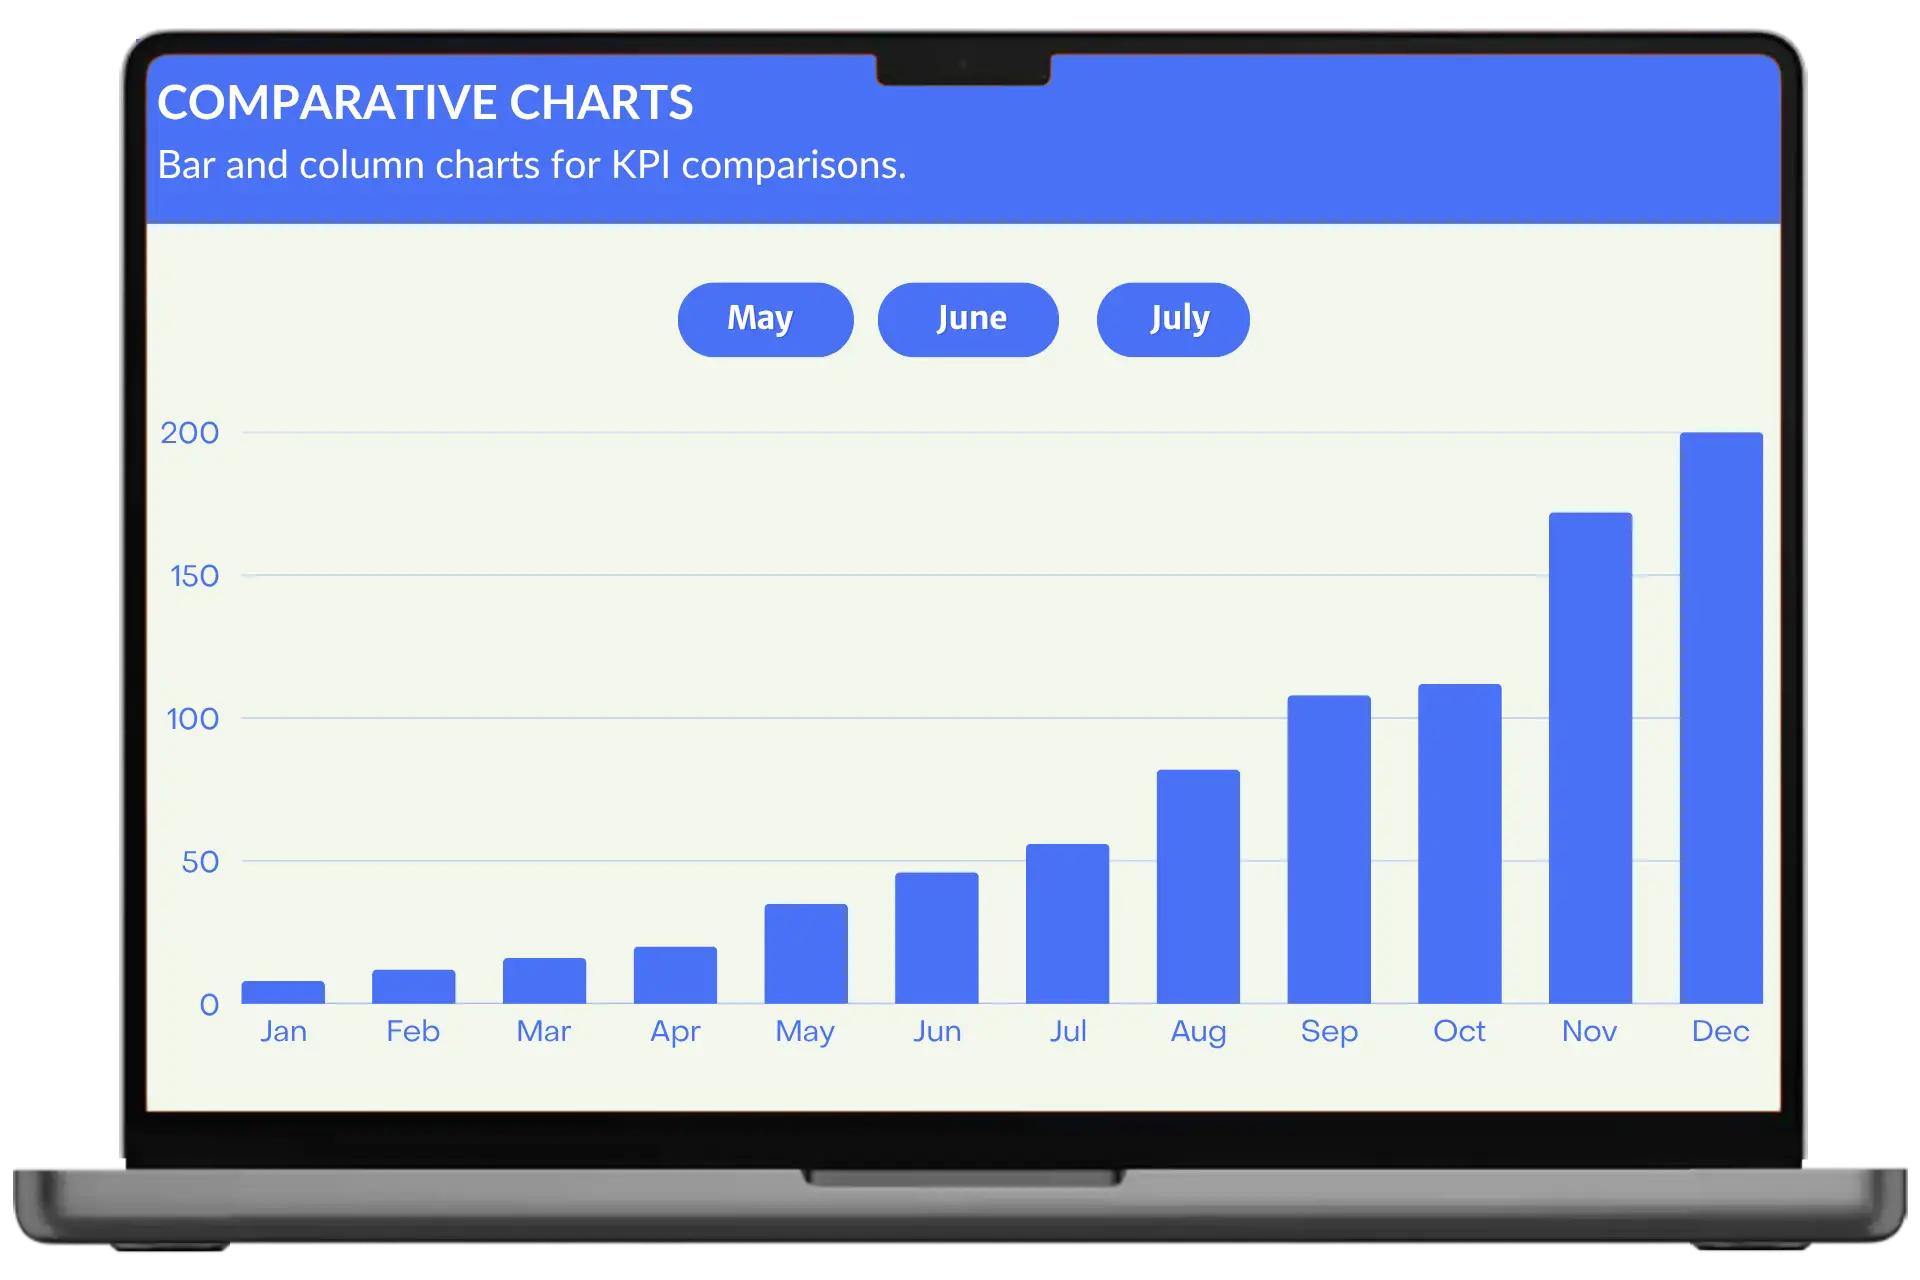
What Are Tableau, Power BI, and Looker?
All three are big data visualization tools that help businesses understand their data better.
Tableau is known for strong data visualization and easy-to-create charts. It is widely used by analysts and data teams.
Power BI is developed by Microsoft and is popular because it is affordable and integrates well with Microsoft tools like Excel and Azure.
Looker, owned by Google, focuses more on data modeling and cloud-based reporting. It is often used in companies that work heavily with Google Cloud.
How Do These Tools Compare in Features?
Each tool has its own strengths. The right choice depends on your business needs.
|
Feature |
Tableau |
Power BI |
Looker |
|
Ease of Use |
Easy for beginners |
Very easy, especially for Excel users |
Moderate learning curve |
|
Visualization Quality |
Excellent |
Good |
Good |
|
Integration |
Works with many data sources |
Strong Microsoft integration |
Best with Google Cloud |
|
Cost |
Expensive |
More affordable |
Pricing varies |
|
Performance |
Strong for large data |
Good for medium to large data |
Strong for cloud data |
This comparison shows that no single tool is perfect for every situation.
Which Tool Is Best for Data Visualization?
If your main goal is to create advanced visual dashboards, Tableau is often the top choice. It offers powerful charts and flexible design options.
Power BI also provides strong visualization features. It is especially useful for businesses already using Microsoft tools.
Looker focuses more on data analysis and reporting rather than complex visual design. It is suitable for companies that need cloud-based analytics.
Businesses often combine these tools with custom data visualization solutions to meet specific needs.
How Do These Tools Support Different Types of Data Analytics?
Businesses use different types of data analytics to understand their data.
These include:
- Descriptive analytics, which shows what has already happened
- Diagnostic analytics, which explains why something happened
- Predictive analytics, which forecasts future trends
- Prescriptive analytics, which suggests actions based on data
All three tools support these analytics types, but their strength depends on how they are used.
For example, Power BI is often used for business reporting, while Looker is useful for deeper data modeling.
What Role Do These Tools Play in Business Decision-Making?
These tools help businesses make better decisions by showing clear insights.
They support:
- Sales tracking and performance analysis
- Marketing campaign monitoring
- Financial reporting
- Customer behavior analysis
In industries like retail, companies use advanced data analytics solutions for retail businesses to understand customer trends and improve sales.
Visualization tools make this process easier by turning complex data into simple dashboards.
How Do Power BI Costs Compare With Other Tools?
Cost is an important factor when choosing a tool.
Power BI is known for being more affordable than Tableau. Many small and medium businesses prefer it for this reason.
However, businesses should also consider power bi consultant cost when planning their projects. Hiring experts can increase the total investment but also improves results.
Tableau usually has higher licensing costs, while Looker pricing depends on usage and cloud setup.
What Is the Difference Between Business Intelligence and Business Analytics?
Many people confuse business intelligence vs business analytics.
- Business intelligence focuses on past data and reporting
- Business analytics focuses on future predictions and deeper insights
Tools like Tableau, Power BI, and Looker support both, but their approach may differ.
Power BI is often used for business intelligence dashboards, while Looker is stronger in analytics and modeling.
How Do These Tools Work With Modern Technology?
Modern businesses use many digital systems. These tools can integrate with different platforms, including databases, cloud services, and applications.
They also work with embedded software development tools, which allow companies to integrate dashboards into their own applications.
This is useful for businesses that want to provide data insights directly to their customers or internal teams.
Which Tool Should You Choose?
The right choice depends on your business needs.
- Choose Tableau if you need powerful and flexible data visualization.
- Choose Power BI if you want a cost-effective solution with strong Microsoft integration.
- Choose Looker if your business relies on cloud data and advanced analytics.
Many companies also use data visualisation consulting services to decide which tool fits their requirements.
Final Thoughts
Tableau, Power BI, and Looker are all powerful tools. Each one has its own strengths and use cases.
Businesses that invest in the right tool and combine it with expert data visualization services usa can gain better insights, improve decision-making, and grow faster.
Instead of choosing based only on popularity, companies should focus on their goals, budget, and data needs. The right tool is the one that makes data simple, clear, and useful for everyday decisions.
Related Article:
Top Techniques and Tools for Big Data Visualization in 2026
What Are The Main Types of Data Analytics and How Do They Work?
Data Visualization in Marketing Campaign Performance Tracking
How Data Visualization Services Help You Make Better Business Decisions?

 Arabic
 French
 Spanish
 Portuguese
 Deutsch
 Turkish
 Dutch
 Italiano
 Russian
 Romaian
 Portuguese (Brazil)
 Greek